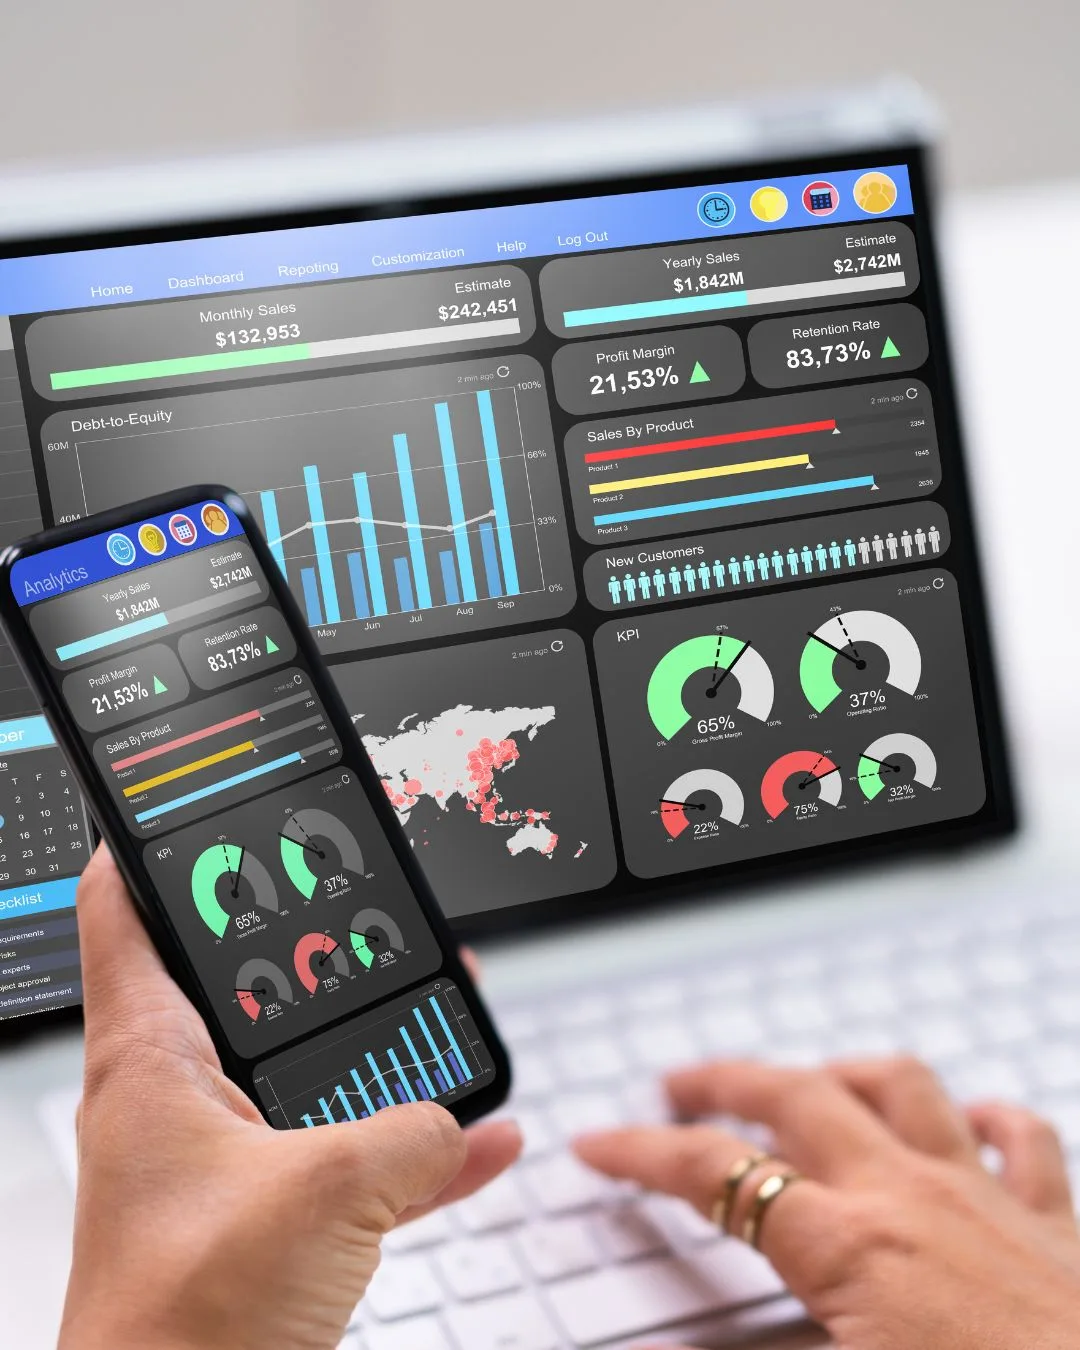
From Chaos to Control: Building Custom Dashboards to Centralize Business Data
Your business generates thousands of data points daily, sales figures, customer interactions, inventory levels, employee metrics, marketing performance. This information holds the keys to smarter decisions and competitive advantages.
Yet most of this valuable data sits trapped in isolated systems, accessible only through time-consuming manual reports. By the time you consolidate everything into a meaningful format, the insights are already outdated.
The solution? A unified business intelligence interface that brings all your critical metrics into one real-time view. At WeGotCode, we help businesses design centralized reporting systems tailored to their unique operational needs. For companies still working with outdated platforms, modernizing legacy software often serves as the essential first step toward effective data centralization.
Why Data Centralization Matters
Modern businesses rely on multiple specialized tools: CRMs for customer relationships, ERPs for inventory management, financial platforms for accounting, analytics software for reporting. While powerful individually, these systems rarely communicate effectively.
The result? Data fragmentation that creates several critical problems:
Time Wasted on Manual Consolidation: Teams spend hours copying data between systems and building reports in spreadsheets. A task that should take minutes consumes entire afternoons.
Decisions Based on Incomplete Information: When data lives in silos, executives make strategic choices without seeing the complete picture. Marketing might launch campaigns without understanding inventory constraints. Sales might pursue deals that strain production capacity.
Version Control Nightmares: Different departments generate conflicting reports from the same underlying data. Everyone argues about which numbers are “correct” instead of solving actual problems.
Missed Opportunities: By the time you recognize important trends through manual analysis, competitors have already responded. Real-time opportunities disappear while you’re still gathering the data.
Centralized reporting platforms solve these issues by consolidating information from every system into a single, automatically-updated interface. Decision-makers access accurate insights instantly, without hunting through multiple applications or waiting for reports.
The Strategic Advantages of Unified Reporting
1. Decisions Backed by Complete Context
Real-time visibility into key performance indicators enables faster, more confident choices. When sales data, marketing metrics, and customer service indicators appear together, you immediately spot correlations that scattered reports conceal.
Example: An e-commerce business notices that social media engagement spikes don’t translate to sales. Their unified view reveals the disconnect – customers are clicking through but abandoning carts due to shipping costs. They adjust pricing strategy within hours instead of weeks.
Businesses concerned about data security during integration can learn more about how secure app development protects business data.
2. Operational Efficiency Through Automation
Automated data collection and visualization eliminate repetitive manual tasks. Your team focuses on analysis and strategy rather than copying numbers between spreadsheets.
Benefits extend beyond time savings. Automation eliminates transcription errors, ensures consistency across reports, and maintains an audit trail of every data point.
3. Alignment Across Departments
When everyone views identical data, organizational friction decreases dramatically. Marketing, sales, and finance coordinate campaigns using shared performance metrics. Production schedules align with actual demand forecasts. Customer service identifies problems before they escalate.
This alignment is only possible when systems are properly integrated with modernized infrastructure that supports secure data sharing.
4. Industry-Specific Intelligence
Generic analytics tools provide limited value because they track universal metrics that might not matter to your business. Purpose-built reporting interfaces focus exclusively on the KPIs that drive your specific industry and operational model.
Retail Dashboard Example: Track real-time inventory levels, cart abandonment rates, average order value, customer lifetime value, supplier delivery performance, and seasonal trend analysis, all in one view.
Healthcare Dashboard Example: Monitor patient wait times, appointment utilization rates, treatment outcome metrics, insurance claim processing status, and staff allocation efficiency simultaneously.
Manufacturing Dashboard Example: Visualize production throughput, equipment downtime, quality control rejection rates, supply chain bottlenecks, and workforce productivity in real-time.
5. Scalable Infrastructure for Growth
Well-architected reporting systems grow alongside your business. Add new data sources, incorporate additional KPIs, and expand functionality without rebuilding the entire platform. As you acquire companies, enter new markets, or launch products, your intelligence infrastructure adapts seamlessly.
Building an Effective Centralized System
Creating impactful business intelligence requires methodical planning and expert implementation. Here’s the proven approach:
Step 1: Define Clear Objectives
Start by identifying what you need to accomplish. Common goals include:
- Reducing monthly reporting time by 75%
- Enabling real-time inventory visibility across locations
- Correlating marketing spend with actual revenue
- Predicting cash flow 90 days in advance
- Monitoring customer satisfaction trends
Specific objectives ensure your system focuses on actionable metrics rather than vanity numbers.
Step 2: Identify Critical Metrics
Determine which data points provide genuine insight versus those that simply look impressive. Quality matters more than quantity. Executives who see 50 metrics will ignore most of them.
Essential Financial Metrics: Revenue trends, profit margins, cash flow projections, expense ratios
Customer Intelligence: Acquisition costs, lifetime value, satisfaction scores, churn rates.
Operational Performance: Cycle times, error rates, capacity utilization, supply chain velocity.
Growth Indicators: Market share trends, new customer velocity, product adoption rates.
Focus relentlessly on the 5-10 metrics that truly drive business outcomes.
Step 3: Integrate Data Sources Securely
Connect your reporting platform to every relevant system through encrypted API integrations. Your unified interface automatically pulls information from CRMs, ERPs, financial tools, and analytics platforms, keeping everything synchronized in real-time.
Professional implementation ensures data security through encryption, authentication protocols, and access controls.
Step 4: Design for Usability
Even the most sophisticated analytics system fails if users can’t quickly interpret the data. Effective interfaces include:
Visual Hierarchy: Most important metrics prominently displayed, supporting details accessible through intuitive navigation
Contextual Visualizations: Charts and graphs chosen specifically for the data type- trend lines for time series, heat maps for geographic distribution, gauges for progress toward targets
Interactive Filtering: Ability to drill down from summary views into detailed breakdowns without switching screens
Smart Alerts: Automated notifications when metrics cross critical thresholds, enabling proactive responses
Mobile Optimization: Executive access from any device, anywhere, anytime!

Step 5: Implement Intelligent Alerts
Automated monitoring detects significant changes and unusual patterns, triggering notifications to relevant stakeholders. This transforms reactive reporting into proactive management.
Example Alert Scenarios:
- Sales velocity drops 20% below forecast → immediate notification to sales leadership
- Customer satisfaction scores decline two consecutive weeks → alert to customer success team
- Inventory levels fall below reorder threshold → notification to procurement
- Website conversion rates spike unexpectedly → alert to marketing for analysis
Step 6: Test Thoroughly Before Launch
Comprehensive validation ensures accuracy, reliability, and usability before full deployment:
- Verify data accuracy against source systems
- Confirm calculations and aggregations perform correctly
- Test under peak load conditions
- Validate alert triggers and notification delivery
- Gather user feedback and refine interface
Step 7: Iterate Based on Real Usage
Intelligence requirements evolve as your business grows and market conditions change. Plan for continuous improvement:
- Monitor which metrics users actually reference
- Add new visualizations based on feedback
- Integrate additional data sources as systems expand
- Refine alerts to reduce noise and increase relevance
Avoiding Common Pitfalls
Even well-intentioned projects can fail without proper guidance:
Information Overload: Displaying 50+ data points on one screen overwhelms users and obscures important signals. Ruthlessly prioritize.
Vanity Metrics: Tracking impressive-sounding numbers that don’t influence decisions wastes attention. Focus exclusively on actionable KPIs.
Stale Data: If your system updates only daily or weekly, users will revert to checking source systems directly. Real-time or near-real-time updates are essential.
Lack of Context: Showing current numbers without historical trends, targets, or benchmarks makes interpretation impossible. Every metric needs context.
Ignoring Mobile: Executives and managers need insights on the go. Mobile-optimized interfaces aren’t optional.
Poor Visual Design: Confusing layouts, cluttered screens, and inappropriate chart types undermine trust in the data. Invest in thoughtful design.
Implementation Timeline Expectations
Project complexity determines duration, but typical phases include:
Weeks 1-2: Requirements gathering, objective definition, metric selection
Weeks 3-6: Data source integration, infrastructure setup, security implementation
Weeks 7-10: Interface design, visualization development, alert configuration
Weeks 11-12: Testing, refinement, user training
Week 13+: Launch, monitoring, iterative improvements
Simple integrations with 2-3 data sources and focused metrics can launch faster, while complex enterprise implementations with dozens of systems may require longer timelines.
Take Control of Your Data
Fragmented systems compromise efficiency, obscure opportunities, and slow decision-making. Centralized business intelligence transforms scattered data into competitive advantage.
Professional implementation ensures your reporting platform is accurate, secure, and aligned with business objectives. The right expertise turns overwhelming data chaos into actionable clarity.
Contact WeGotCode to learn how our team can design a centralized reporting system that transforms your business operations.
FAQs
- What distinguishes custom dashboards from off-the-shelf analytics tools?
Pre-built solutions track generic metrics that may not align with your business model. Purpose-built systems focus exclusively on the KPIs that matter to your specific operations, industry, and strategic objectives.
- How do centralized systems improve cross-departmental collaboration?
When every team views identical real-time data, conflicts over report accuracy disappear. Departments align strategies based on shared understanding rather than debating whose numbers are correct.
- Can reporting platforms integrate with both cloud and on-premise systems?
Yes. Professional implementation supports secure integration across diverse infrastructure through encrypted APIs, maintaining data consistency regardless of where systems reside.
- How do we prevent dashboard systems from becoming outdated?
Scalable architecture allows continuous evolution—adding metrics, integrating new data sources, and expanding functionality as business needs change. Regular usage analysis identifies improvement opportunities.
- What’s the typical ROI timeline for centralized reporting?
Most businesses see positive returns within 6-9 months through reduced reporting labor, faster decision-making, and improved operational efficiency. Specific ROI varies based on data complexity and implementation scope.


